

CompTIA DA0-001 Test Engine Practice Test Questions, Exam Dumps
100% Free DA0-001 Daily Practice Exam With 398 Questions
NEW QUESTION # 50
An analyst is currently working on a ticket for revamping a company-wide dashboard that has been in use for five years. Which of the following should be the first step in the development process?
- A. Build an additional dashboard with fewer views that are tailored toward each specific team.
- B. Talk to the group that made the request to determine the desired goal.
- C. Develop a more streanMined dashboard to roll out by the next delivery date.
- D. Make changes to a frequently used report that is already in production.
Answer: B
Explanation:
The first step in the development process of revamping a company-wide dashboard should be to talk to the group that made the request to determine the desired goal. This would help to understand the needs, expectations, and preferences of the stakeholders, as well as the scope, purpose, and objectives of the project.
Talking to the group that made the request would also help to establish a clear communication channel, build rapport and trust, and solicit feedback and suggestions.
NEW QUESTION # 51
Which one the following is not considered an aggregate function?
- A. SUM
- B. MIN
- C. SELECT
- D. MAX
Answer: C
Explanation:
Explanation
The option that is not considered an aggregate function is SELECT. An aggregate function is a function that performs a calculation on a set of values and returns a single value. Examples of aggregate functions are SUM, MIN, MAX, AVG, COUNT, etc. SELECT is not an aggregate function, but a SQL command that is used to select data from a table or a query. Reference: SQL Aggregate Functions - W3Schools
NEW QUESTION # 52
An analyst needs to join two tables of data together for analysis. All the names and cities in the first table should be joined with the corresponding ages in the second table, if applicable.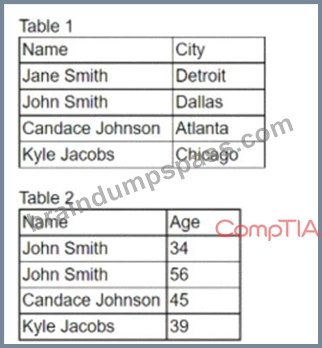
Which of the following is the correct join the analyst should complete. and how many total rows will be in one table?
- A. OUTER JOIN, seven rows
- B. RIGHT JOIN. five rows
- C. LEFT JOIN. four rows
- D. INNER JOIN, two rows
Answer: C
Explanation:
The correct join the analyst should complete is B. LEFT JOIN, four rows.
A LEFT JOIN is a type of SQL join that returns all the rows from the left table, and the matched rows from the right table. If there is no match, the right table will have null values.A LEFT JOIN is useful when we want to preserve the data from the left table, even if there is no corresponding data in the right table1 Using the example tables, a LEFT JOIN query would look like this:
SELECT t1.Name, t1.City, t2.Age FROM Table1 t1 LEFT JOIN Table2 t2 ON t1.Name = t2.Name; The result of this query would be:
Name City Age Jane Smith Detroit NULL John Smith Dallas 34 Candace Johnson Atlanta 45 Kyle Jacobs Chicago 39 As you can see, the query returns four rows, one for each name in Table1. The name John Smith appears twice in Table2, but only one of them is matched with the name in Table1. The name Jane Smith does not appear in Table2, so the age column has a null value for that row.
NEW QUESTION # 53
Given the table below: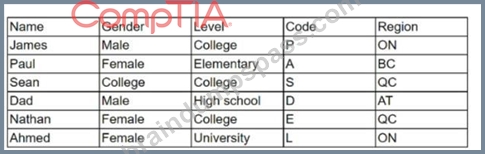
Which of the following variables can be considered inconsistent, and how many distinct values should the variable have?
- A. Code, four
- B. Gender, two
- C. Region, five
- D. Level, three
- E. Name, one
Answer: B
Explanation:
The table provided shows an inconsistency in the 'Gender' column, which lists three distinct values: Male, Female, and College. This is inconsistent because 'College' is not a gender category. The 'Gender' column should only have two distinct values, typically 'Male' and 'Female', to accurately represent gender data. This error could be due to a data entry mistake or a misclassification during data collection.
In data analysis, it's crucial to ensure that categorical variables like gender are consistent and correctly classified, as this can significantly impact the analysis results. Data cleaning processes often involve identifying and correcting such inconsistencies to maintain the integrity of the data set.
References:
* Data quality management principles emphasize the importance of consistency in data values, especially for categorical variables like gender1.
* Best practices in data cleaning include checking for and rectifying inconsistencies or misclassifications in data sets2.
* The importance of accurate data classification is highlighted in data analysis literature, as it directly affects the validity of the analysis results3.
NEW QUESTION # 54
Which of the following should be accomplished NEXT after understanding a business requirement for a data analysis report?
- A. Determine the data necessary for the analysis
- B. Build a mock dashboard/presentation layout.
- C. Rephrase the business requirement.
- D. Perform exploratory data analysis.
Answer: D
NEW QUESTION # 55
Which of the following best describes the law of large numbers?
- A. As a sample size decreases, its mean gets closer to the average of the whole population.
- B. As a sample size decreases, its standard deviation gets closer to the average of the whole population.
- C. As a sample size grows, its mean gets closer to the average of the whole population
- D. When a sample size doubles. the sample is indicative of the whole population.
Answer: C
Explanation:
The best answer is B. As a sample size grows, its mean gets closer to the average of the whole population.
The law of large numbers, in probability and statistics, states that as a sample size grows, its mean gets closer to the average of the whole population. This is due to the sample being more representative of the population as it increases in size. The law of large numbers guarantees stable long-term results for the averages of some random events1 A: As a sample size decreases, its standard deviation gets closer to the average of the whole population is not correct, because it confuses the concepts of standard deviation and mean. Standard deviation is a measure of how much the values in a data set vary from the mean, not how close the mean is to the population average.
Also, as a sample size decreases, its standard deviation tends to increase, not decrease, because the sample becomes less representative of the population.
C: As a sample size decreases, its mean gets closer to the average of the whole population is not correct, because it contradicts the law of large numbers. As a sample size decreases, its mean tends to deviate from the average of the whole population, because the sample becomes less representative of the population.
D: When a sample size doubles, the sample is indicative of the whole population is not correct, because it does not specify how close the sample mean is to the population average. Doubling the sample size does not necessarily make the sample indicative of the whole population, unless the sample size is large enough to begin with. The law of large numbers does not state a specific number or proportion of samples that are indicative of the whole population, but rather describes how the sample mean approaches the population average as the sample size increases indefinitely.
NEW QUESTION # 56
An analyst needs to know what data an organization possesses. Which of the following is the best document for the analyst to consult?
- A. Data retention policy
- B. Data destruction policy
- C. Data use document
- D. Data dictionary
Answer: D
Explanation:
Comprehensive and Detailed In-Depth Explanation:
Adata dictionaryis the best resource for understanding what data an organization possesses. It providesmetadataabout datasets, including:
* Field names and definitions
* Data types (e.g., numeric, text, Boolean)
* Allowed values and constraints
* Relationships between different data fields
* Option A (Data destruction policy):Incorrect. This document outlines procedures for securely deleting data but does not describe the data the organization currently possesses.
* Option B (Data use document):Incorrect. This document explains how data should be used but does not provide a comprehensive inventory of available data.
* Option C (Data dictionary):Correct.The data dictionary is a structured reference that describes all available data assets within an organization.
* Option D (Data retention policy):Incorrect. This policy dictates how long data is stored but does not provide details about what data exists.
NEW QUESTION # 57
Chris is building a database to store prices for items on a restaurant menu.
What data type is most appropriate for this field?
- A. Numeric.
- B. Tags.
- C. Date.
- D. Alphanumeric.
Answer: A
Explanation:
Prices are numbers stored in dollars and cents; as such, the data type needs to be capable of storing numbers.
NEW QUESTION # 58
Five dogs have the following heights in millimeters:
300,430, 170, 470, 600
Which of the following is the standard deviation for the five dogs?
- A. 147mm
- B. 21,704mm
- C. 394 mm
- D. 154mm
Answer: D
Explanation:
The correct answer is B. 154 mm.
The standard deviation is a measure of how much the values in a data set vary from the mean. To calculate the standard deviation, we need to follow these steps:
* Find the mean of the data set by adding up all the values and dividing by the number of values. In this case, the mean is (300 + 430 + 170 + 470 + 600) / 5 = 394 mm.
* Find the difference between each value and the mean, and square it. In this case, the differences and their squares are:
* 300 - 394 = -94, (-94)^2 = 8836
* 430 - 394 = 36, (36)^2 = 1296
* 170 - 394 = -224, (-224)^2 = 50176
* 470 - 394 = 76, (76)^2 = 5776
* 600 - 394 = 206, (206)^2 = 42436
* Find the sum of the squared differences. In this case, the sum is 8836 + 1296 + 50176 + 5776 + 42436 =
108520.
* Divide the sum by the number of values. In this case, the result is 108520 / 5 = 21704. This is called the variance.
* Take the square root of the variance. In this case, the result is sqrt(21704) = 147.32 mm. This is called the standard deviation.
Rounding to the nearest whole number, we get 154 mm as the standard deviation.
NEW QUESTION # 59
Given the table below:
Which of the following boxes indicates that a Type Il error has occurred?
- A. 0
- B. 1
- C. 2
- D. 3
Answer: A
Explanation:
Explanation
A Type II error is a false negative conclusion, which means failing to reject a null hypothesis that is actually false. In the table, box 3 indicates that a Type II error has occurred, because it shows that the null hypothesis is accepted when it is false in reality. This means that the statistical test failed to detect a significant difference or relationship that actually exists. References: Type I & Type II Errors | Differences, Examples, Visualizations - Scribbr, Type I and type II errors - Wikipedia
NEW QUESTION # 60
An analyst needs to conduct a quick analysis. Which of the following is the FIRST step the analyst should perform with the data?
- A. Conduct a trend analysis and use a scatter chart.
- B. Conduct an exploratory analysis and use descriptive statistics.
- C. Conduct an initial analysis and use a Pareto chart.
- D. Conduct a link analysis and illustrate the connection points.
Answer: B
NEW QUESTION # 61
A company needs a report that provides executives an overview and regional managers with both an overview and specifics. Which of the following reporting elements will achieve these results?
- A. Observations and insights
- B. Drill-down function
- C. Live data feed
- D. Access permissions
Answer: B
Explanation:
A drill-down function allows users to start with a high-level summary of the data and then click through to see more detailed layers of information. This feature is particularly useful in business intelligence and reporting systems, as it provides executives with a broad overview while enabling managers to explore specific data points relevant to their regions or operations.
NEW QUESTION # 62
A data analyst needs to present the results of an online marketing campaign to the marketing manager. The manager wants to see the most important KPIs and measure the return on marketing investment. Which of the following should the data analyst use to BEST communicate this information to the manager?
- A. A summary with statistics, conclusions, and recommendations from the data analyst
- B. A spreadsheet of the raw data from all marketing campaigns and channels
- C. A real-time monitor that allows the manager to view performance the day the campaign was launched
- D. A sell-service dashboard that allows the manager to look at the company's annual budget performance
Answer: A
Explanation:
A summary with statistics, conclusions, and recommendations from the data analyst is the best way to communicate the results of an online marketing campaign to the marketing manager. A summary can provide a concise and clear overview of the most important KPIs and measure the return on marketing investment, as well as highlight the main findings and insights from the data analysis. A summary can also include actionable suggestions and best practices for improving the campaign performance and achieving the marketing objectives. A summary is different from other options, such as a real-time monitor, a self-service dashboard, or a spreadsheet of raw data, which may not provide enough context, interpretation, or guidance for the manager. Therefore, the correct answer is D. References: How to Write a Data Analysis Report: 6 Essential Tips, How to Write a Marketing Report (with Pictures) - wikiHow
NEW QUESTION # 63
Which of the following techniques should an analyst use to analyze a data set to get a snapshot of basic measures of central tendency?
- A. Gap analysis
- B. Trend analysis
- C. Descriptive statistics
- D. Forecasting
Answer: C
Explanation:
Comprehensive and Detailed In-Depth Explanation:
Measures of central tendency are statistical metrics that describe the center point or typical value of a dataset.
The primary measures include mean (average), median (middle value), and mode (most frequent value).
* Descriptive Statistics: This branch of statistics involves summarizing and organizing data to describe its main features. It includes calculating measures of central tendency (mean, median, mode) and measures of dispersion (range, variance, standard deviation). Descriptive statistics provide a comprehensive snapshot of the dataset's characteristics.
* Forecasting: This involves making predictions about future data points based on historical data. While valuable for planning, it doesn't provide insights into the current dataset's central tendency.
* Trend Analysis: This technique examines data over time to identify patterns or trends. It's useful for understanding data direction but doesn't focus on central tendency measures.
* Gap Analysis: This method compares actual performance with potential or desired performance, identifying gaps between current and expected outcomes. It doesn't relate to measures of central tendency.
Therefore, to obtain basic measures of central tendency, an analyst should employ descriptive statistics.
NEW QUESTION # 64
Which of the ing is the correct ion for a tab-delimited spre file?
- A. tap
- B. az
- C. sv
- D. tar
Answer: C
Explanation:
A tab-delimited spreadsheet file is a type of flat text file that uses tabs as delimiters to separate data values in a table. The file extension for a tab-delimited spreadsheet file is usually .tsv, which stands for tab-separated values. Therefore, the correct answer is C. Reference: [Tab-separated values - Wikipedia], [What is a TSV File? | How to Open, Edit & Convert TSV Files]
NEW QUESTION # 65
A data analyst for a media company needs to determine the most popular movie genre. Given the table below: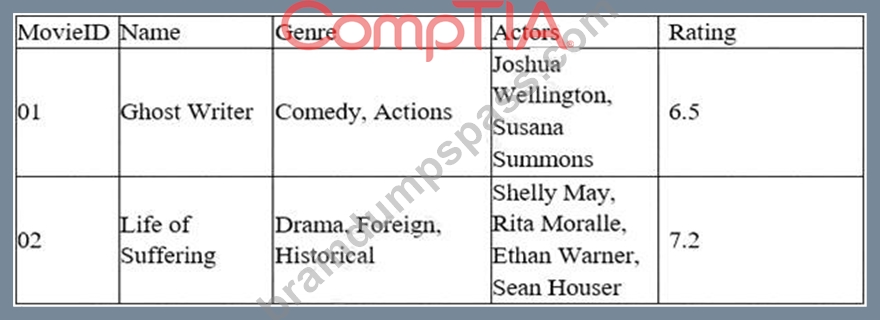
Which of the following must be done to the Genre column before this task can be completed?
- A. Concatenate
- B. Append
- C. Delimit
- D. Merge
Answer: C
Explanation:
Explanation
The action that must be done to the Genre column before this task can be completed is delimit. Delimit is a process of separating or splitting a string of text into multiple parts based on a delimiter, which is a character or a sequence of characters that marks the boundary between the parts. For example, a comma (,) or a semicolon (;) can be used as a delimiter. In this case, the Genre column contains multiple genres for each movie, separated by commas. To determine the most popular movie genre, the data analyst needs to delimit the Genre column by commas, so that each genre can be counted and compared separately. The other options are not relevant for this task, as they are related to combining or joining strings or tables, not separating them.
Append is a process of adding or attaching one string or table to the end of another string or table. Merge is a process of combining or joining two or more tables into one table based on a common column or key.
Concatenate is a process of joining or linking two or more strings together into one string. Reference: [How to Split Text in Excel - Exceljet]
NEW QUESTION # 66
A data analyst needs to apply quality control concepts to a data set for accuracy. Which of the following is the best way to do this?
- A. Parameterization
- B. Standardization
- C. Cross-validation
- D. Encryption
Answer: C
NEW QUESTION # 67
A data analyst for a media company needs to determine the most popular movie genre. Given the table below: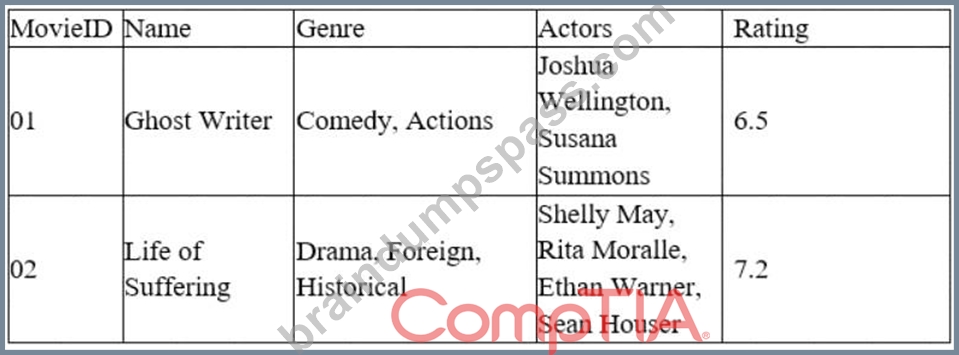
Which of the following must be done to the Genre column before this task can be completed?
- A. Concatenate
- B. Append
- C. Delimit
- D. Merge
Answer: C
Explanation:
Explanation
Delimiting is the process of splitting a column of data into multiple columns based on a separator or delimiter character. Delimiting can help separate data that is combined or concatenated in one column into distinct values or categories. For example, if a column contains text values that are separated by commas, such as
"Comedy, Suspense", delimiting can split this column into two columns, one for "Comedy" and one for
"Suspense". Delimiting is different from other options, such as appending, merging, or concatenating, which are methods of combining or joining data from multiple columns or sources. In this case, the data analyst needs to determine the most popular movie genre based on the Genre column in the table. However, this column contains multiple genres for each movie, separated by commas. Therefore, the data analyst must delimit this column before this task can be completed. Therefore, the correct answer is D. References: Split text into different columns with functions - Office Support, How to Split Text in Excel (Using Formulas & Split Function)
NEW QUESTION # 68
An analyst is required to run a text analysis of data that is found in articles from a digital news outlet. Which of the following would be the BEST technique for the analyst to apply to acquire the data?
- A. ETL
- B. Sampling
- C. Web scraping
- D. Data wrangling
Answer: C
Explanation:
Explanation
This is because web scraping is a technique that allows the analyst to extract data from web pages, such as articles from a digital news outlet. Web scraping can be done using various tools and methods, such as Python libraries, browser extensions, or online services. The other techniques are not suitable for acquiring data from web pages. Here is why:
Sampling is a technique that involves selecting a subset of data from a larger population, usually for statistical analysis or testing purposes. Sampling does not help the analyst to acquire data from web pages, but rather to reduce the amount of data to be analyzed.
Data wrangling is a technique that involves transforming and cleaning data to make it suitable for analysis or visualization. Data wrangling does not help the analyst to acquire data from web pages, but rather to improve the quality and usability of the data.
ETL stands for Extract, Transform, and Load, which is a process that involves moving data from one or more sources to a destination, such as a data warehouse or a database. ETL does not help the analyst to acquire data from web pages, but rather to store and organize the data.
NEW QUESTION # 69
Which of the following entities would NOT be regulated by the Health Insurance Portability and Accountability Act (HIPAA)?
- A. A healthcare provider.
- B. A health information clearinghouse.
- C. A health and fitness mobile app.
- D. A health insurance company.
Answer: C
NEW QUESTION # 70
Which of the following variable name formats would be problematic if used in the majority of data software programs?
- A. First_Name
- B. First_Name_
- C. FirstName
- D. First Name
Answer: D
Explanation:
This is because First Name is a variable name format that would be problematic if used in most of the data software programs, such as Excel, SQL, or Python. This is because First Name contains a space between two words, which could cause confusion or errors in the data software programs, as they might interpret the space as a separator or a delimiter between two different variables or values, rather than as part of a single variable name. For example, in SQL, a space is used to separate keywords, clauses, or expressions in a statement, such as SELECT, FROM, WHERE, etc. Therefore, using First Name as a variable name in SQL could result in a syntax error or an unexpected result. The other variable name formats would not be problematic if used in most of the data software programs. Here is why:
First_Name_ is a variable name format that uses an underscore (_) to separate two words, which is a common and acceptable practice in most of the data software programs, as it helps to improve the readability and clarity of the variable name. For example, in Python, an underscore is used to follow the PEP 8 style guide for naming variables, which recommends using lowercase letters and underscores for multi-word variable names.
FirstName is a variable name format that uses camel case to separate two words, which is another common and acceptable practice in most of the data software programs, as it helps to reduce the length and complexity of the variable name. For example, in Excel, camel case is used to follow the VBA naming conventions for naming variables, which recommends using mixed case letters for multi-word variable names.
First_Name is a variable name format that also uses an underscore (_) to separate two words, which is also a common and acceptable practice in most of the data software programs, as it helps to improve the readability and clarity of the variable name. For example, in SQL, an underscore is used to follow the ANSI SQL naming standards for naming variables, which recommends using lowercase letters and underscores for multi-word variable names.
NEW QUESTION # 71
An analyst is building a new dashboard for a user. After an initial conversation with the user. the analyst created a mock-up of the dashboard. Which of the following best explains why the analyst created the mock- up?
- A. To receive client approval for the final dashboard design
- B. To identify the dimensions and measures
- C. To confirm important details before dashboard development begins
- D. To send to the client after deploying the dashboard to production
Answer: C
Explanation:
To confirm important details before dashboard development begins.
A dashboard mockup is a prototype of a finished dashboard directly in the product. It is a way to visualize the layout, design, and functionality of the dashboard before it is built with real data and code. A dashboard mockup can help the analyst to confirm important details with the user, such as the business objectives, the key performance indicators, the data sources, the filters, the charts, and the interactivity.By creating a dashboard mockup, the analyst can get immediate feedback and validation from the user,and avoid wasting time and resources on developing a dashboard that does not meet the user's expectations or needs1.
NEW QUESTION # 72
Given the customer table below: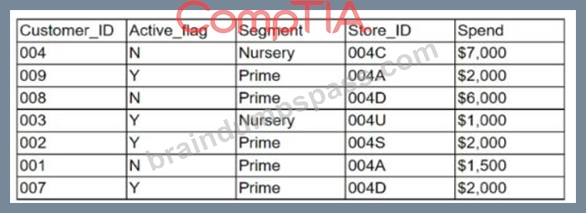
Which of the following chart types is the most appropriate to represent the average spending of active customers vs. inactive customers?
- A. Pie chart
- B. Scatter plot
- C. Heat graph
- D. Line chart
Answer: A
NEW QUESTION # 73
A client has requested an analysis of all pet care items purchased by current customers and their social media connections in the past 12 months. Which of the following data analysis techniques would be the best choice given these requirements?
- A. Exploratory data analysis
- B. Trend analysis
- C. Performance analysis
- D. Link analysis
Answer: D
NEW QUESTION # 74
Which of the following is the most appropriate to consider when creating a schema of a central group broken into detailed subcategories?
- A. Hierarchical
- B. Snowflake
- C. Star
- D. Relational
Answer: A
Explanation:
Comprehensive and Detailed In-Depth Explanation:
When designing a database schema that represents a central entity with multiple levels of related subcategories, it's crucial to choose a structure that efficiently models these relationships.
Option A:Relational
* Rationale: A relational database organizes data into tables with rows and columns, using keys to establish relationships between tables. While flexible, the relational model doesn't inherently represent hierarchical relationships, making it less ideal for schemas requiring parent-child data representation.
Option B:Hierarchical
* Rationale: The hierarchical database model structures data in a tree-like format, with a single root (central group) and multiple levels of nested subcategories (parent-child relationships). This model is well-suited for scenarios where data is naturally hierarchical, such as organizational charts or file systems.
NEW QUESTION # 75
......
Use Valid New DA0-001 Test Notes & DA0-001 Valid Exam Guide: https://www.braindumpspass.com/CompTIA/DA0-001-practice-exam-dumps.html
DA0-001 exam torrent CompTIA study guide: https://drive.google.com/open?id=1mCI8MEcYAnE8_cMiqsnx7SQ9q1qRIJ2S